Mlungisi Ndlela
Hi Mlungisi Ndlela here 👋🏻 Welcome to my portfolio. I'm thrilled you're here. As a former video editor with a keen eye for detail and a flair for storytelling, I've transitioned into the realm of data analytics, where I now focus on extracting compelling narratives from raw datasets.My expertise lies in Data Analysis, Translation, and Visualization. I leverage tools such as Excel, SQL, and Tableau to uncover insights and present them in meaningful ways. Take a look at some of my projects below!
Featured Projects

Northwind Traders Analysis | SQL
The Northwind Traders Data Analysis Project focuses on extracting valuable insights from various aspects of the business, including employees, products, suppliers, and revenue. Through a comprehensive analysis of the company's data, the project aims to provide actionable information to support informed decision-making...
Superstore Sales Dashboard | Tableau
A detailed analysis of Superstore sales for various different products and accessories while also calculating the profit to sales differential and using the insights gained to create a visual dashboard to better convey this information to stakeholders.


Immunization (Flu Shots Analysis)
SQL | Tableau
Healthcare Data Analysis focusing on the immunization (Flu shots) for patients for various age ranges and different counties. This analysis is then used to create a dashboard using Tableau.
Nashville Housing Data Cleaning | SQL
A detailed cleaning of data using SQL for the Nashville Housing Project using a variety of methods to clean out duplicates, null values and arrange date and time columns accordingly.


Accident Data 2021-2022 | Excel
In this project we analyse Accident Data recorded in 2021-2022 and viewed the KPIs and EDA using Excel and created a dynamic Dashboard from out findings.
Emergency Room Dashboard | Tableau
Building an Emergency room Dashboard using Tableau to gain insights into the workings of Healthcare.

Copyright © 2024 | Mlungisi Ndlela
Website edited by Wynot_SA
NorthWind Traders Analysis
Microsoft SQL Server Project
Find Top 10 Products by name

Utilizing the SELECT statement, I cherry-picked the top 10 products based on their names. Leveraging the sum aggregation function, I calculated the quantity of each product, labeling it as "Number of units" for clarity. By joining the Order Details and Products tables on the common column Product_ID, I forged a cohesive narrative of sales data. Grouping the data by product name revealed the total cumulative sum of each product, showcasing their sales prowess. Finally, I ordered the results in descending order of "Number of units," ensuring the top sellers claimed their rightful place at the forefront.
Utilizing DENS_RANK() to find the rank of products sold

I retrieved ProductName, customer City, and Quantity using the SELECT statement. To rank products based on Quantity, I introduced the DENSERANK() window function. This function assigned a dense rank to each product without leaving gaps. Organizing the results by Quantity in ascending order was achieved with the ORDER BY clause. By incorporating DENSERANK(), I obtained both the top products and their corresponding ranks based on Quantity, providing valuable insights into sales performance.
Use CASE statement to classify products based on their stock

I extracted essential product details, such as IDs, names, and stock status, using CASE statements to evaluate different conditions. This allowed me to categorize products into distinct statuses like Negative Inventory - Order Now!, Reorder level reached - Place Order, Discontinued, or In Stock, based on factors such as UnitsInStock, UnitsOnOrder, and Discontinued fields. The ReorderLevel served as a crucial trigger for stock replenishment. By providing this comprehensive overview, my query equips decision-makers to act promptly and effectively, whether it's placing orders, managing inventory, or addressing discontinued products.
Create a List of Products with current and future required Stock
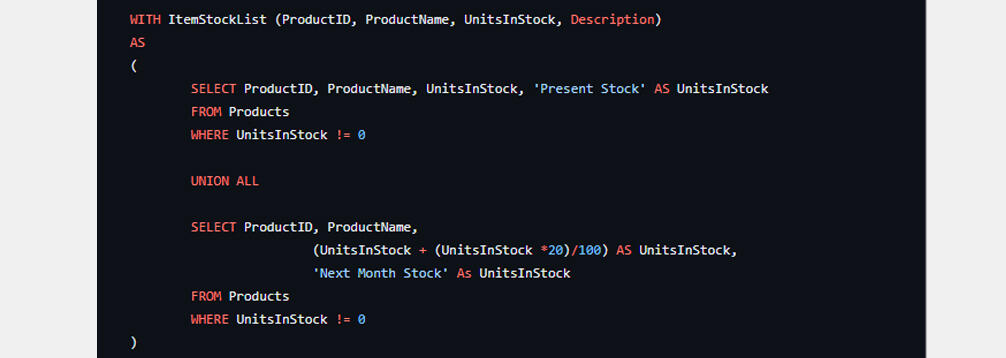
To obtain a holistic view of product stock, I created a CTE named "ItemStockList." It combines two SELECT statements using UNION ALL. The first selects products with UnitsInStock not equal to 0 and labels them as 'Present Stock.' The second simulates next month's stock by adding 20% to current stock levels and labels it as 'Next Month Stock.' Finally, I retrieved all columns from the "ItemStockList" CTE to present a comprehensive snapshot of present and projected stock levels.
Find the customer with the third highest sale value
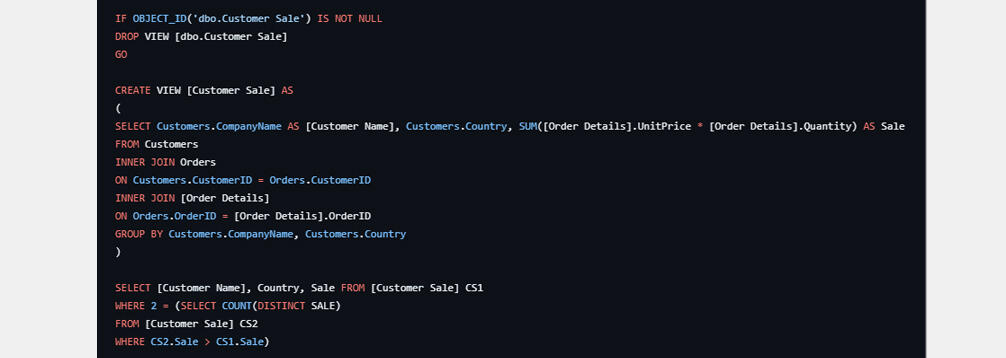
I started by checking for the existence of the "SaleYear" view in the database using OBJECTID(). If it existed, I dropped it with DROP VIEW. Then, I created a new "Sale_Year" view with CREATE VIEW, tailored to provide insights into customers' yearly sales data. This involved selecting customer company names, order years, and calculating sale amounts per order by multiplying product unit prices with quantities ordered. I ensured data coherence by performing an inner join between Customers, Orders, and Order Details tables. After creating the view, I extracted data from it. Using PIVOT, I pivoted sales data by year (2016, 2017, and 2018), aggregating sales with SUM(sale) for a clear yearly sales overview. Finally, I arranged results alphabetically by customer name with ORDER BY, ensuring an organized presentation.
I appreciate you taking the time to visit my portfolio!
If you'd like to chat about me joining your data team, feel free to email me!
SuperStore Sales Analysis
Tableau Project

In this Tableau project, I employed various chart formations to visually represent and analyze sales and profit data. The diverse range of charts allowed for a comprehensive exploration of different aspects of the business, offering insights into the relationship between sales, profit, regional performance, and product categories.Dual Chart:
- The dual chart was utilized to showcase the comparison between sales and profit over different years based on the order date. This visualization effectively established the correlation between sales volumes and the corresponding profit margins, providing a holistic view of the financial performance over time.Stacked Column Chart:
- The stacked column chart was employed to highlight variations in profit across different regions. By categorizing sales by region and breaking down the stack by product categories, the chart effectively communicated which items contributed most to profit in specific regions. This visual representation aids in identifying regional strengths and weaknesses in terms of profitability.Pie Chart:
- A pie chart was implemented to illustrate the distribution of sales for various items in the superstore. This visual representation allowed for a quick and clear understanding of which items were the highest-selling, providing a visual snapshot of the product portfolio's performance.Packed Bubble Chart:
- The packed bubble chart was chosen to present a detailed view of individual items sold. The size of each bubble represented the performance of the item, allowing for a quick comparison of the popularity and success of different products. This visualization method is effective for understanding not only what items sold but also how well they performed relative to each other.Bar Chart:
- The bar chart was employed to showcase the number of items sold by category. By arranging the chart in descending order, it facilitated a clear identification of the highest and lowest selling categories. Including the exact number of sales next to each item category provided a precise quantification, enhancing the understanding of the sales distribution across different product categories.In summary, this Tableau project utilized a variety of visualizations to provide a comprehensive analysis of sales and profit data. Each chart formation was strategically chosen to convey specific aspects of the business, allowing stakeholders to make informed decisions based on a visually intuitive representation of the data. The project successfully transformed raw data into actionable insights, contributing to effective decision-making within the organization.
I appreciate you taking the time to visit my portfolio!
If you'd like to chat about me joining your data team, feel free to email me!
Nashville Housing Data Cleaning
Microsoft SQL Server Project
Standardize the Date Time format

I made use of the Alter Table feature to add a column called SaleDateConverted and them populated that column using the initial date column that was present on the table but I converted it to use a more standardized date format as the initial one felt out of place and was less uniformed.
Populate Property Address Data

I made use of a self join to join the table to itself and the reason for this was to utilized data within the table to fill another column where some data was not filled in or listed as null, after completion of this join I then updated the table so that the new values could be visible on the main table moving forward so that I wouldn't have to rerun the same query on multiple occasions.
Separate the Address into separate columns (Address, City, State)


I selected the property address column then split it using the comma character as the point if splitting and I redid this using different string functions such as -1 to say it should split the string back to front and +1 to split it in the opposite direction and once this was done I modified the table to add property address column, property city and property state column and then populated these columns with the string characters that I had just split from the columns respectfully. The reason for this split was to remove the clutter of having everything in a singular column and it also allowed for one to be able to track the data by city, state and property alot easier.
Change Y and N to Yes and No in "Sold as Vacant" field

I selected the SoldAsVacant column where some of the values were listed as Y and N instead of Yes and No. I utilized the CASE statement to change Y to Yes and N to No and if it had any other value besides these two it should be listed as SoldAsVacant and upon this query working successfully I then modified it onto the table using the UPDATE statement and ran the query using SET so that the values would be changed permanently onto the table we are using.
Remove Duplicates

I created a CTE and selected all columns that I required for this query, I then used partition by so I could return a single value for each row, I ordered them using the Unique ID column so I could locate the duplicated info in the rows, I then selected everything from the CTE and used the drop column to delete the duplicated columns which were owner address, taxi district, property address and saledate columns.
I appreciate you taking the time to visit my portfolio!
If you'd like to chat about me joining your data team, feel free to email me!
Flu Shot (Vaccination) Analysis
PostgreSQL | Tableau Project

I created two CTE tables and used them to do a one to one relational join on the tables so that it wouldn't create duplicatesCTE table 1:
- I created this CTE to extract the ages of the patients that were older that 6 months
- The reason for selecting older than 6 months was because children less then 6 months can't be vaccinatedCTE table 2:
- I created this CTE to only select the earliest vaccinated for each patient
- The reason for this was so as to not get multiple vaccination results from the same patient which would cause duplication of informationI then joined both CTE's to the main select clause where I used a left join where I ustilized a 1 to 1 relational join using the ID column from the patients table to the CTE of flu shot 2022 table in the patients column as this was a unique identifier.

In this Tableau project, I focused on transforming healthcare data, derived from a SQL query, into an insightful and interactive dashboard. The primary goal was to create a user-friendly interface that provides a comprehensive overview of flu vaccination compliance across different age groups, locations, and the overall population:Calculated Fields and Age Segmentation:
I started by creating a calculated field to segment flu shots by age groups. This segmentation provided a granular understanding of vaccination trends across different demographics, enabling more targeted insights into age-specific compliance rates.Percentage of Total Calculation:
To assess compliance, I utilized the percentage of total calculation. This allowed me to determine the proportion of individuals who were compliant and up-to-date with their flu vaccinations relative to the total population. The resulting percentage provided a clear indicator of vaccination adherence.SUM Function for Total Flu Shots:
The SUM function was employed to calculate the total number of flu shots administered. This key metric served as a foundational element in understanding the scale of vaccination efforts and evaluating the overall impact on public health.Running Sum of Flu Shots by Location:
A dynamic element was introduced through the creation of a running sum of flu shots, linked to various locations in the UK. This dynamic table allowed for an intuitive exploration of vaccination data based on location. Selecting a specific location modified the view accordingly, providing a focused and tailored perspective on flu vaccination trends in different areas.By combining these elements, the Tableau healthcare dashboard offers a multi-dimensional exploration of flu vaccination data. Users can drill down into specific age groups, assess compliance rates, understand the total number of flu shots administered, and gain insights into location-specific trends. The interactive nature of the dashboard enhances user engagement, fostering a data-driven approach to healthcare decision-making. This project not only visualizes vaccination data effectively but also empowers healthcare professionals to make informed decisions to improve public health outcomes.
I appreciate you taking the time to visit my portfolio!
If you'd like to chat about me joining your data team, feel free to email me!
Road Accident Data Analysis
Microsoft Excel Project

I made use of Data Cleaning, Transformation, Analysis and used the resulting data to create a Dynamic Dashboard Report from this project of Accident Data recorded in 2021-2022. I analysed the data and the following KPIs and EDA
- Total Casualties
- Number of Casualty by Severity
- No. of Casualties by Road Type, Vehicle Type
- No. of Casualties by Road Surface
- No. of Casualties by Lightning Condition
- No of casualties by Location
I appreciate you taking the time to visit my portfolio!
If you'd like to chat about me joining your data team, feel free to email me!
Emergency Room Dashboard
Tableau Project

Created an emergency room visits dashboard where by patients were analysed to visualize different aspects of the data such as:
- Total number of patients in the Emergency Room
- The percentage according to gender
- The average wait time of patients in minutes
- The number of patients visiting by different age groups
- Patients visit by Race
- The patient visits according to the different referrals
- A heat map to show the volume of visits during the different hours and days of the week
I appreciate you taking the time to visit my portfolio!
If you'd like to chat about me joining your data team, feel free to email me!